
[ad_1]
Yields are on the rise because the Federal Reserve is unwinding its balance sheet.
The Fed balance sheet was approximately $4.5 trillion before the unwinding began a year ago. The process began at just $10 billion per month in Q4 2017. In Q1 2018, it jumped to $20 billion per month. In Q2 it jumped to $30 billion per month. In Q4, the pace was $40 billion per month. Starting this month, the pace accelerates to $50 per month and could last through the year 2020. As of the end of September, the balance sheet stood at $4.193 trillion, a drain of $307 billion.
As of Oct. 3, the balance sheet has been reduced to $4.175 trillion. This is a drain of $18 billion in the first three days of October as the 10-Year yield rose from 3.05% on Sept. 28 to as high as 3.25% on Oct. 5. The Federal Reserve is right on schedule!
Today I will show daily charts and discuss my value levels, pivots and risky levels.
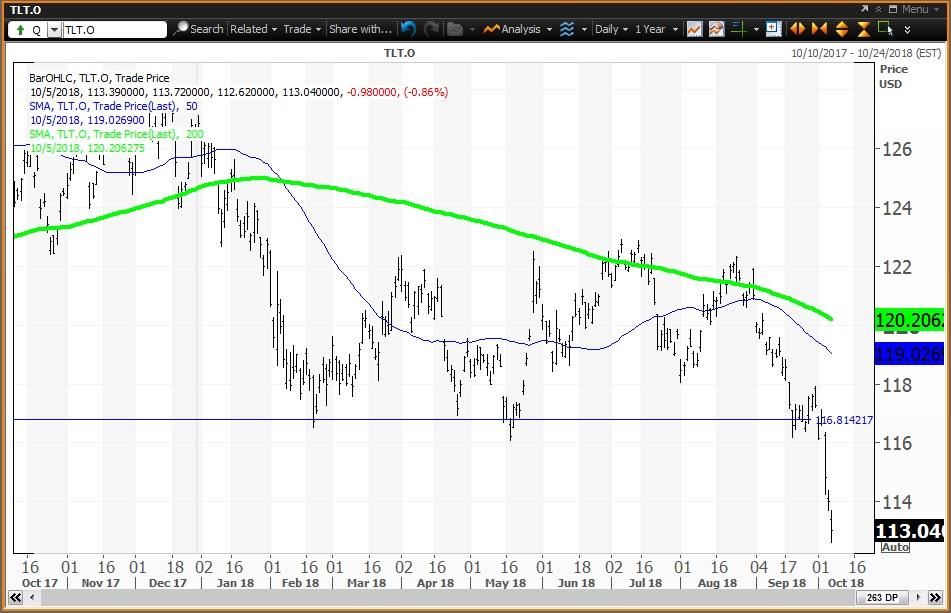
The 20+ Year Treasury Bond ETF (NYSEARCA:TLT)
The U.S. Treasury 30-Year Bond ETF trades like a stock and is a basket of U.S. Treasury bonds with maturities of 20+ years to 30 years. As a stock-type investment it never matures, and interest income is converted to periodic dividend payments.
Courtesy of MetaStock Xenith
The Treasury Bond ETF ($113.04 on Oct. 5) is down 10.9% year to date and the weekly chart remains negative with the ETF below its five-week modified moving average of $117.89 and below its 200-week simple moving average or “reversion to the mean” at $125.03. It’s been below this average since the week of Jan. 19. The 12x3x3 weekly slow stochastic reading declined to 24.37 last week down from 30.90 on Sept. 28.
Investor Strategy: Buy weakness to my quarterly value level of $105.77 and reduce holdings on strength to my monthly pivot at $116.81.
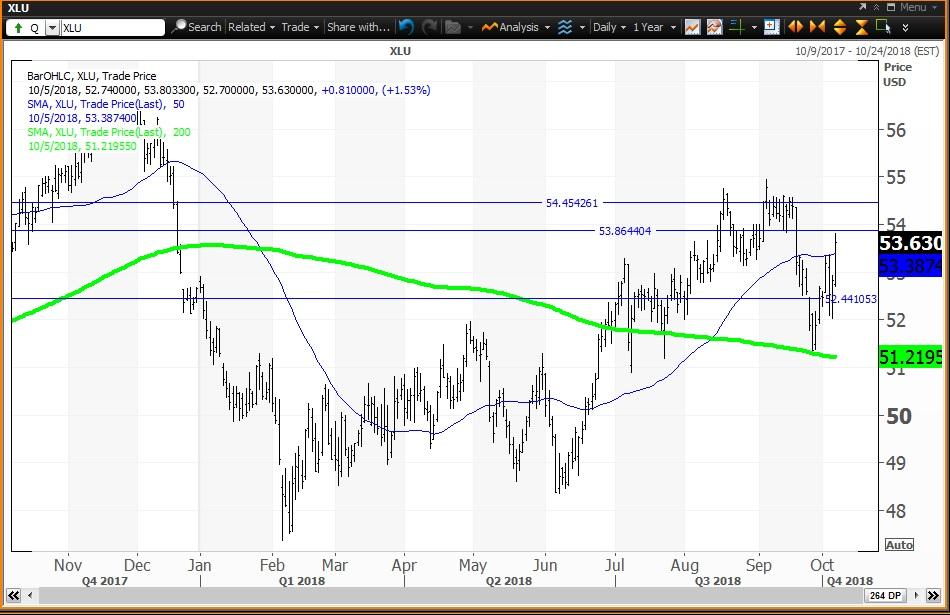
The Utilities Select Sector SPDR Fund (NYSEARCA:XLU)
Courtesy of MetaStock Xenith
The Utility Stock ETF ($53.62 on Oct. 5) is up 1.8% year to date and its weekly chart ended last week neutral. XLU is above its five-week modified moving average of $53.30 and is above its 200-week simple moving average of $48.97. This “reversion to the mean” was last tested during the week of Feb. 9 when the average was $47.56. The 12x3x3 weekly slow stochastic reading ended last week slipping to 67.70, down from 74.52 on Sept. 28. Investors should continue to hold a core long position given its 3.40% dividend yield.
Investor Strategy: Investors should buy weakness to the 200-week simple moving average at $48.93 and reduce holdings on strength to my semiannual, quarterly and annual pivots of $53.86, $54.42 and $54.46, respectively. My monthly pivot is $52.44. Note how XLU held its 200-day simple moving average of 51.30 on Sept. 26.
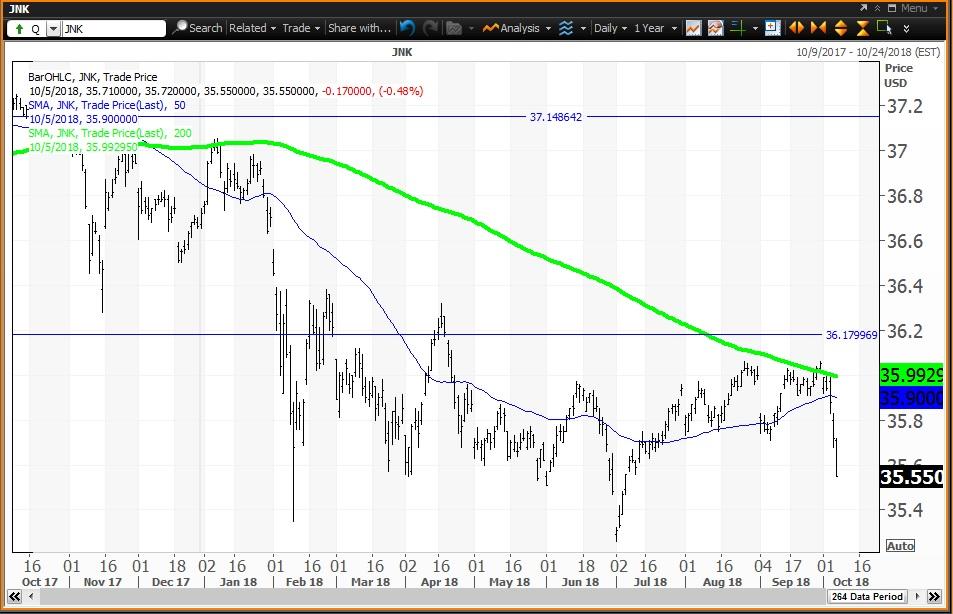
SPDR Bloomberg Barclays High Yield Bond ETF (NYSEARCA:JNK)
Courtesy of MetaStock Xenith
The Junk Bond ETF ($35.55 on Oct. 5) is down 3.2% year to date with a negative weekly chart. The ETF is below its five-week modified moving average of $35.85 and is below its 200-week simple moving average of $36.52. JNK has been below this “reversion to the mean” since the week of Nov. 14, 2014, when the average was $40.08. The 12x3x3 weekly slow stochastic reading ended last week falling to 78.60, down from 86.58 on Sept. 28 with the reading falling below the overbought threshold of 80.00 this week.
Investor Strategy: Buy weakness to my semiannual value level of $31.15 and reduce holdings on strength to my quarterly, annual and quarterly risky levels of $36.18, $37.15 and $37.23, respectively. My monthly pivot is $35.09. Note how this ETF failed at its 200-day simple moving average of $36.02 on Sept. 27.
The Global Debt Story
According to data from four sources including the IMF, global debt totals $233 trillion. Non-Financial Corporate Debt totals $68 trillion. Government Debt totals $63 trillion. Financial Sector Debt totals $58 trillion. Household Debt totals $44 trillion. As rates rise, the debt bubble will break!
Disclosure: I/we have no positions in any stocks mentioned, and no plans to initiate any positions within the next 72 hours.
I wrote this article myself, and it expresses my own opinions. I am not receiving compensation for it (other than from Seeking Alpha). I have no business relationship with any company whose stock is mentioned in this article.
[ad_2]
Source link
